
Arrythmias and EKGs
Interested in watching this lesson as a video? If so, click here
When reading EKGs, it’s important that you read it the same way each time.
Rhythm:
In a healthy heart, the signal usually starts at the Sinoatrial (SA) node. The electricity then moves to the atrioventricular (AV) node, down the Bundle of His Purkinje Fibers, and then to the Right and Left Bundle Branches.


When looking at an EKG, you can tell that the rhythm is originating from the sinus node if:
There is a p - wave before every QRS
The p - wave is upright in leads I, II, III, aVF, and aVL, while it is downright in aVR

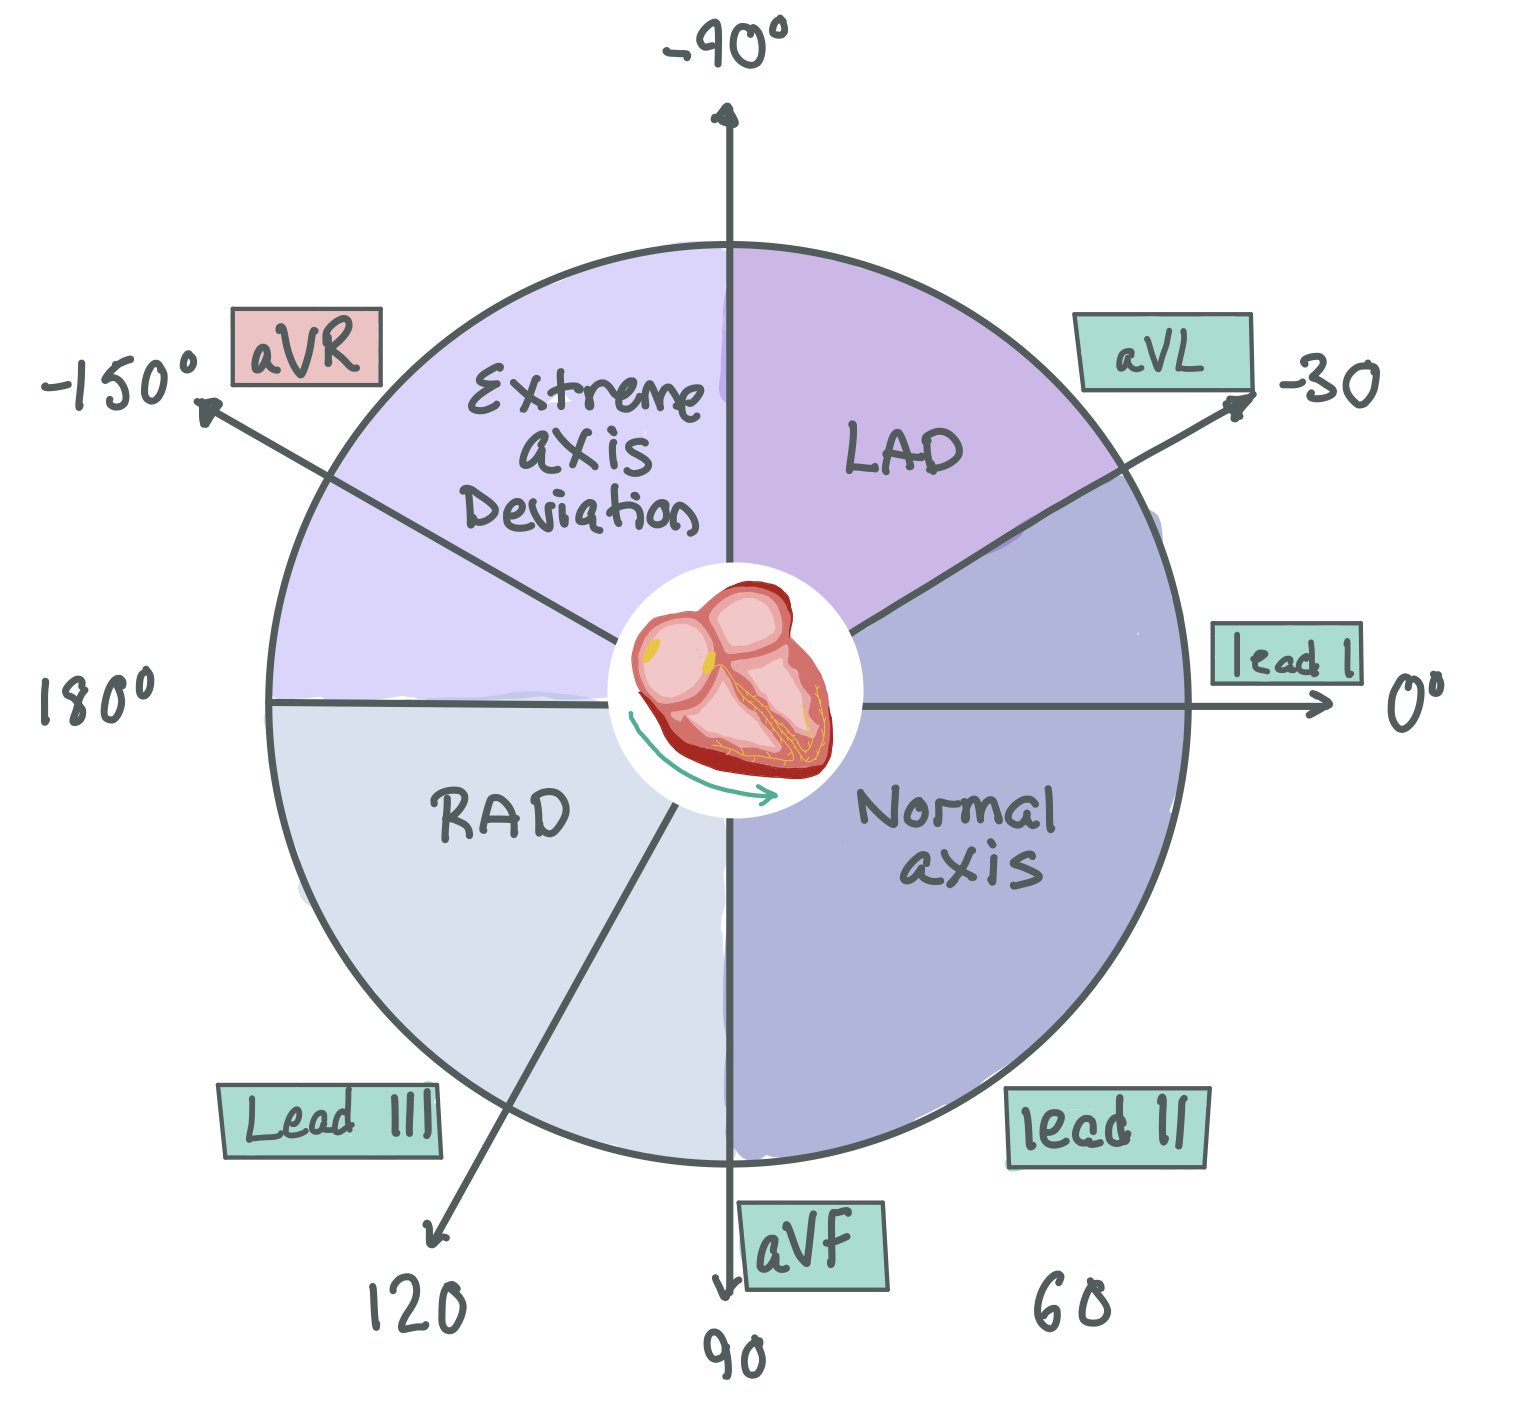
In order to understand why the p-waves are upright in these leads, it helps to remember the heart axis and which way the vectors point. In the picture below, we see that the electricity is moving towards Leads I, II, III, aVF, and aVL and away from aVR
2. Rate
There are two main ways to measure rate:
A. Count the number of QRS complexes and multiple x 6. Since each EKG is 10 seconds long, counting the number of complexes and multiplying x 6 gives you beats per minute (bpm).
B. The big box trick.

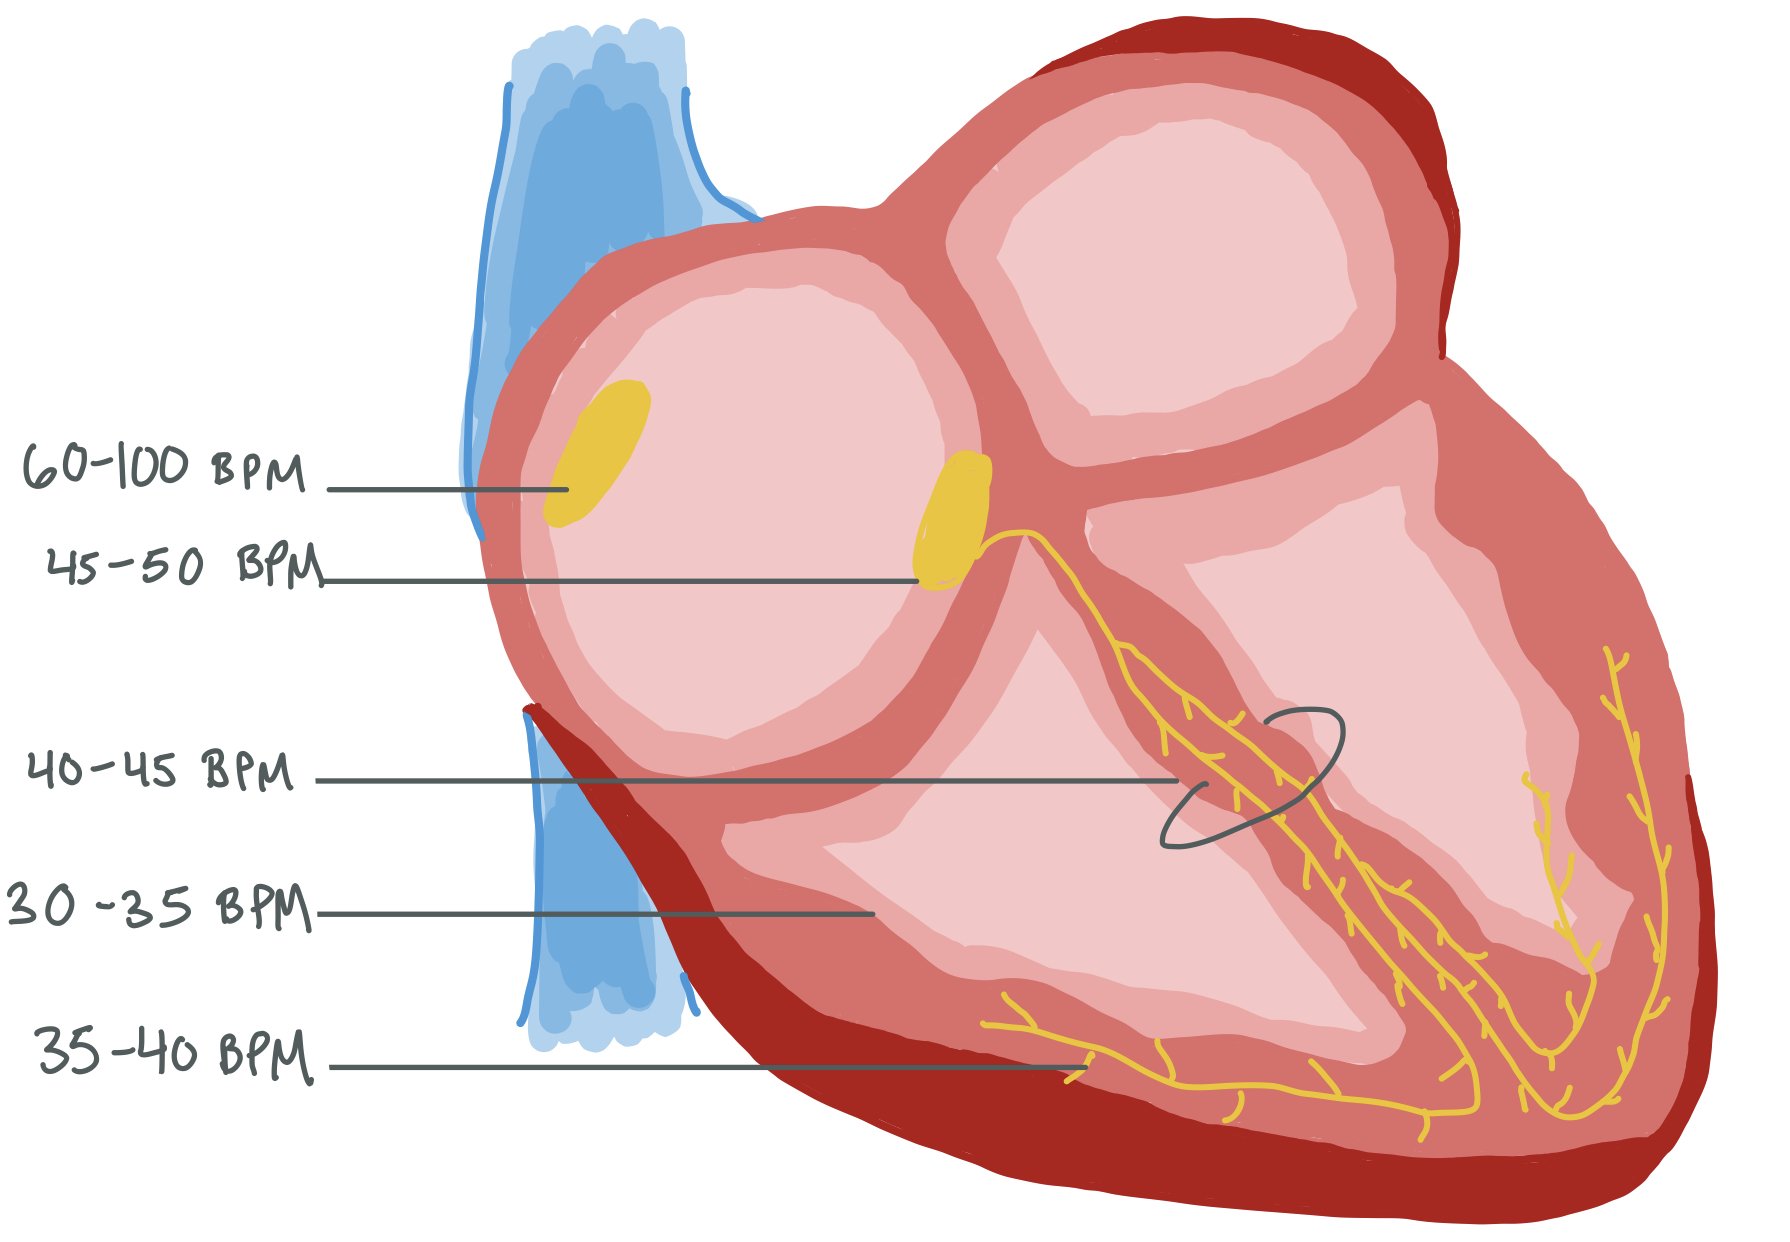
The heart has multiple “fail-safes,” meaning that if the sinus node stops working, the atrioventricular node will become the new pacemaker. If the atrioventricular node stops working, the Bundle of His picks up the pace next. The picture below shows the different pacing rates of each part of the conduction system, from the sinus node —> atrioventricular node —> Bundle of His —> Purkinje Fibers
3. Axis
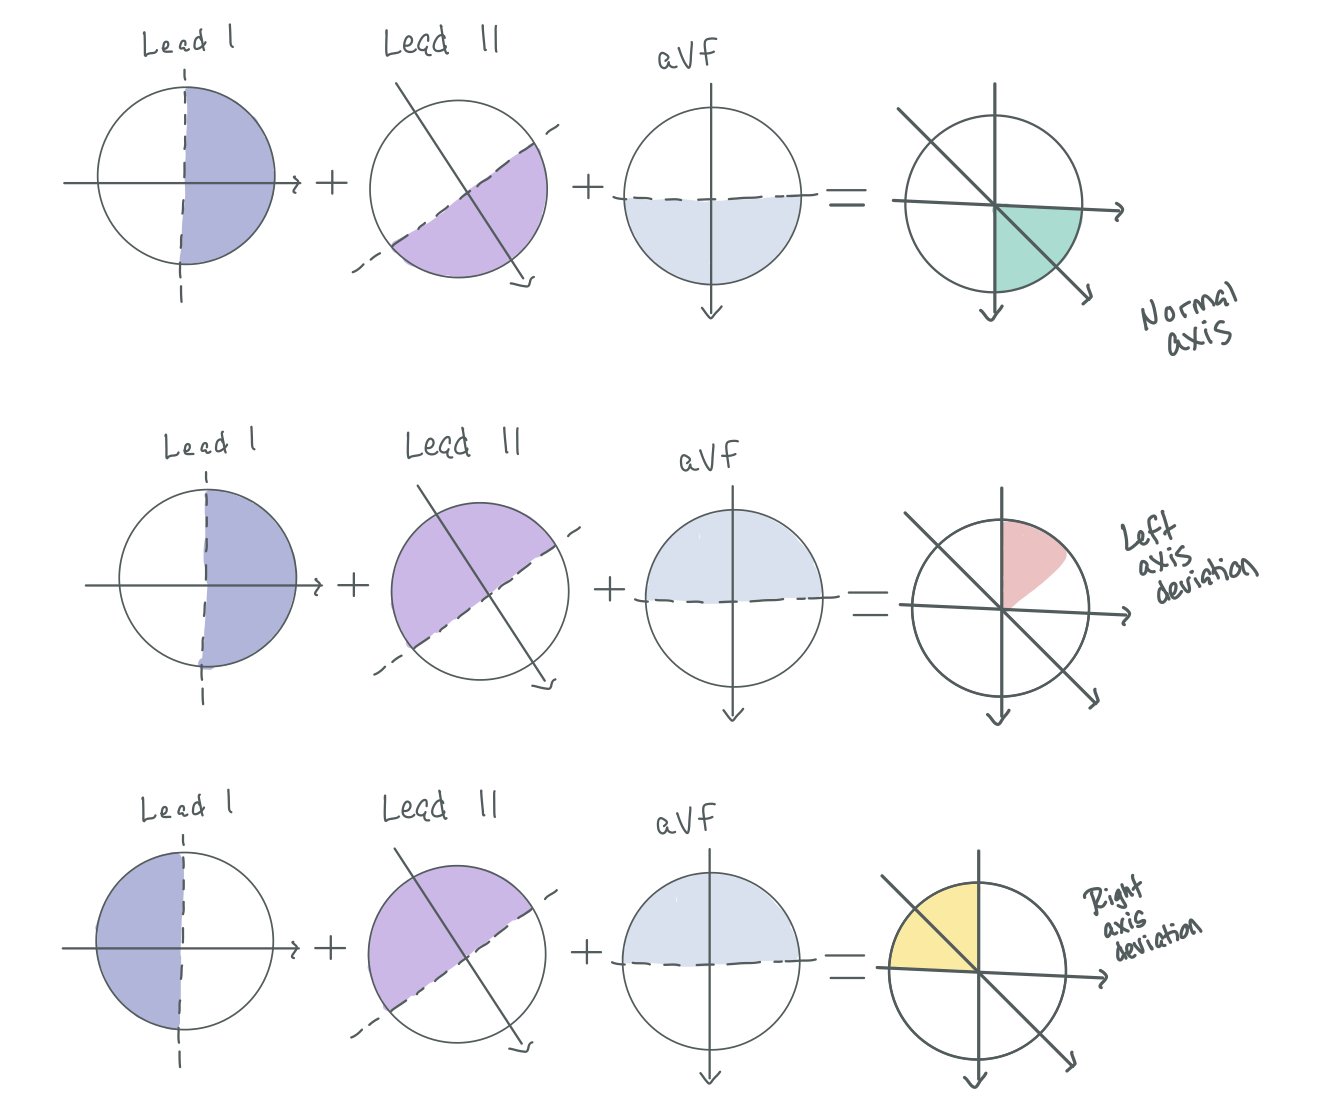
When determining axis, you look at leads I, II, and aVF.
Draw 3 circles with the vectors for Leads I, II, and aVF
Draw a line half-way between the front and back of the arrow.
Look at Leads I, II, and aVF. If they are positive, shade in the side of the circle closest to the arrowhead. If they are negative, fill in the other side of the circle.
Finally, see where all the circles overlap. Look at the heart axis diagram to determine your patient’s heart axis.
4. Intervals
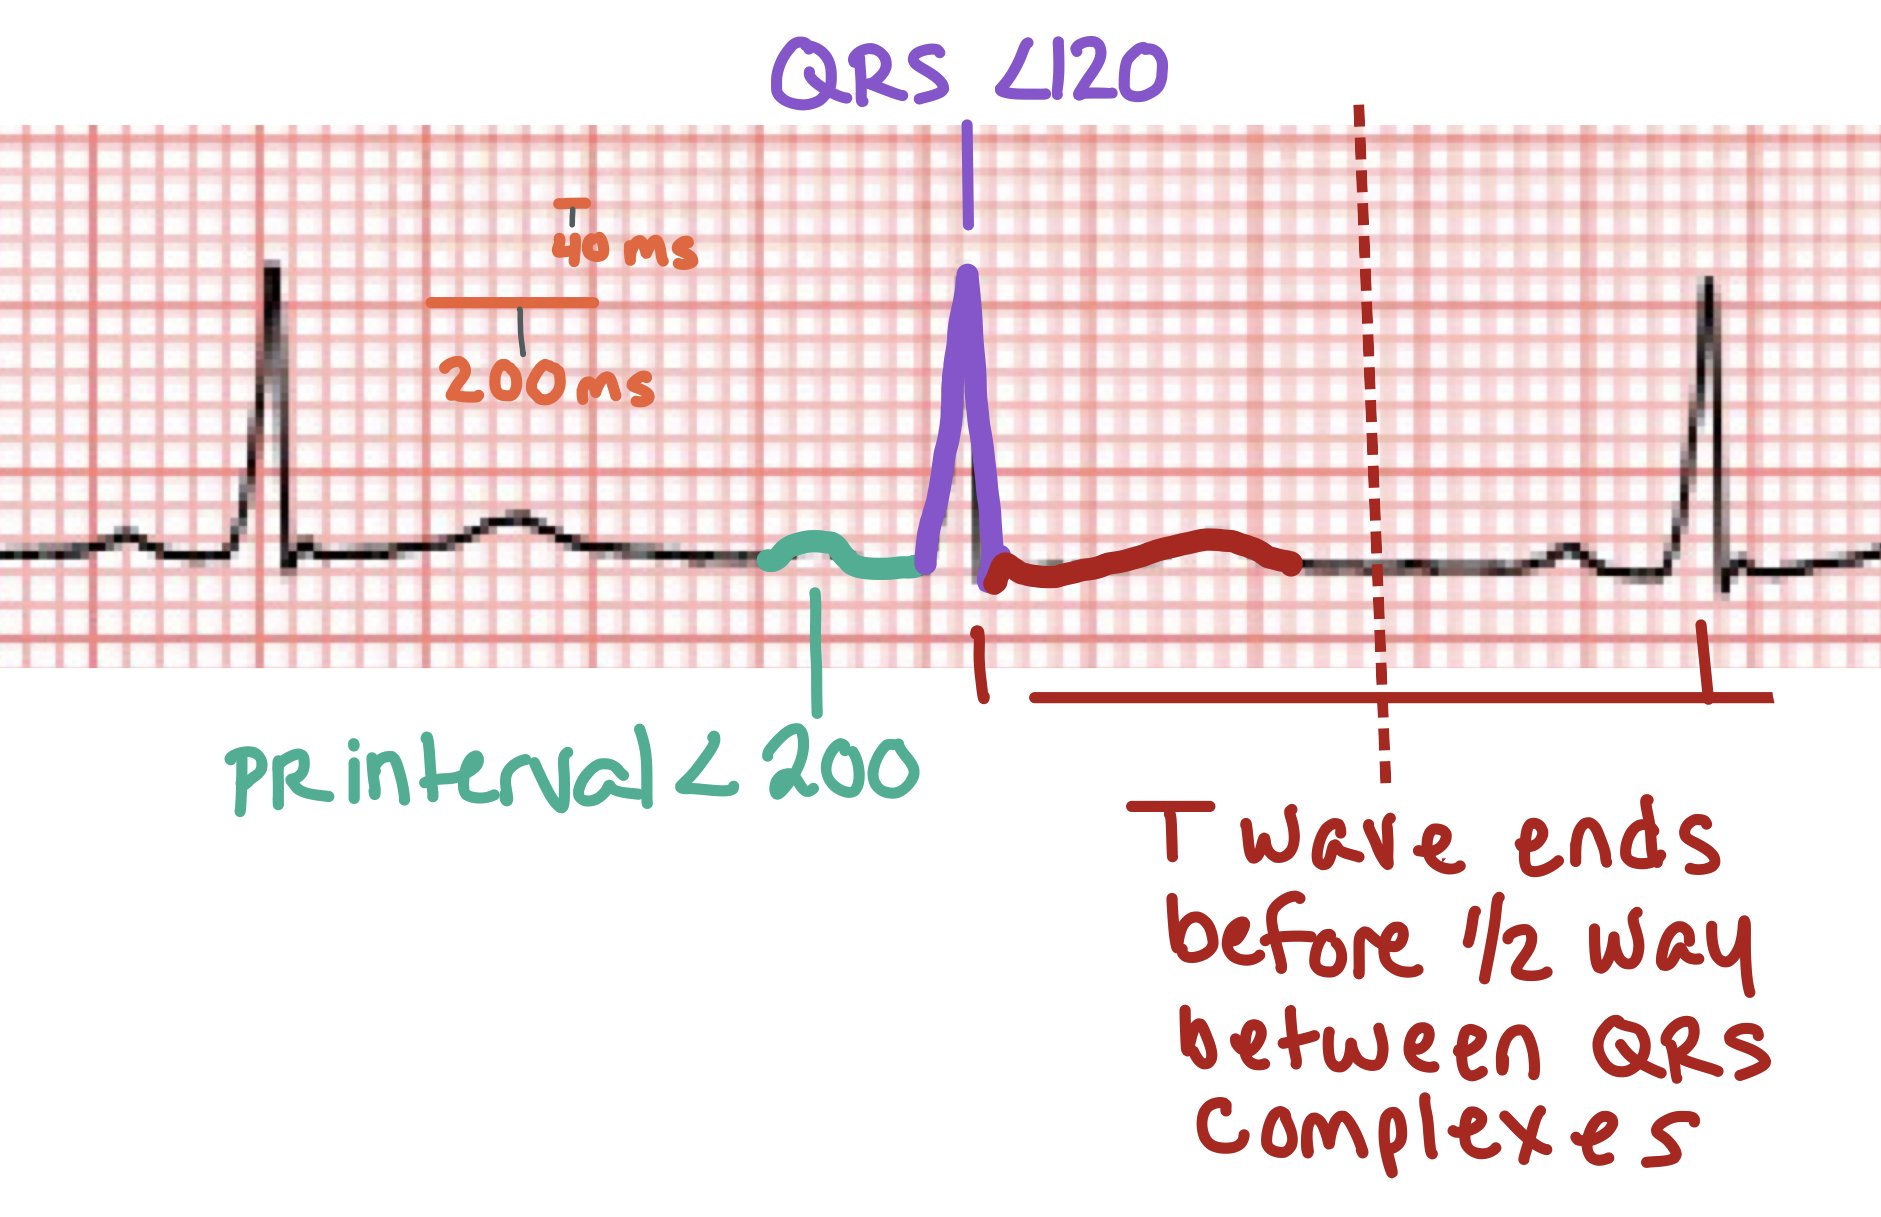
Each small box is 40 ms
Normal PR interval is < 200 ms (or 1 big box)
QRS is <120 ms (3 small boxes)
QTc:
Men: 350 - 440 ms
Women: 360 - 460 ms
How does the QRS get prolonged? When the signal does not efficiently go from the SA node → AV node → Bundle of His → Right and Left Bundle Branches, sometimes this can cause a prolongation of the QRS. For instance, if there is a right bundle branch block, the signal goes from the SA node → AV node → Bundle of His → Left Bundle Branch. The signal then has to move from the left side of the heart through the myocardium to the right side. This prolonged activation of ventricular contraction causes a prolonged QRS.

Normally, the signal is moving away from V1 → V6. From a vector standpoint, this means that in a normal heart with correctly placed leads, the signal should be negative in V1 and become more positive as it moves towards V6.

In a RBBB, the signal goes from the SA node → LBBB and then has to move towards the right side of the heart. If you think about what the electricity is actually doing (as seen in the picture of the cross-sectional view of the chest), the signal is moving from the left side of the heart towards the right side. As such, the signal is going towards V1 so it will be positive.

In a LBBB, the signal moves from the right side of the heart towards the left side. When looking at the cross sectional view, the signal is still going away from V1 and towards V6. As such, V1 is still negative, while V6 is positive.
5. ST elevations / depressions or T wave inversions
Look to see if the J point on the EKG is higher than the equilibrium point.

How’d we do?
The following individuals contributed to this topic: